Wondering why Grafana is an ideal choice for visualising your Kubernetes metrics? This post explores the benefits of using Grafana to gain deep insights into your Kubernetes environment, from installation through to best practices for creating effective dashboards.
Why Use Grafana for Kubernetes Monitoring?
Grafana is the world’s most popular platform for building dashboards. It empowers users to query, visualise, alert, and understand metrics across diverse data sources—Prometheus, Graphite, AWS CloudWatch, and more. With Grafana, you can create, explore, and share highly customisable dashboards for almost any use case. As an open-source tool, it provides significant cost savings compared to proprietary options, making it accessible and versatile.
This post offers a streamlined guide to installing and configuring Grafana for Kubernetes, covering essential setup and best practices to get you up and running quickly.
Installing Grafana on Kubernetes
Installing Grafana on Kubernetes can be done in several ways: manually with YAML, using a third-party provider, or through Helm. For most users, Helm is the quickest and simplest way to deploy Grafana on Kubernetes. The Grafana Helm chart enables a full installation and configuration in just a few commands:
helm repo add grafana https://grafana.github.io/helm-charts
helm repo update
helm install grafana grafana/grafanaNote: The default Helm installation does not persist data. This means any data will be lost if the Grafana pods are terminated.
To enable persistent storage, create a Persistent Volume for Grafana before installation. Here’s an example configuration:
apiVersion: v1
kind: PersistentVolume
metadata:
  name: grafana
spec:
  capacity:
    storage: 10Gi
  volumeMode: Filesystem
  hostPath:
    path: /mnt/grafana
  accessModes:
    - ReadWriteOnce
Then, install Grafana with persistent storage enabled:
helm install grafana grafana/grafana --set persistence.enabled=trueIf you have a specific storage class, set persistence.storageClassName to match it. To adjust the claim size, use the persistence.size parameter. You can find more configuration options in the Grafana Helm chart documentation.
Accessing Grafana
Grafana can be securely exposed to users through your preferred Kubernetes Ingress Controller. For quick access, however, you can use kubectl port-forward to validate the setup. First, retrieve the default ‘admin’ password:
kubectl get secret grafana -o jsonpath="{.data.admin-password}" | base64 --decodeThen, set up port forwarding:
export POD_NAME=$(kubectl get pods --namespace default -l "app.kubernetes.io/name=grafana,app.kubernetes.io/instance=grafana" -o jsonpath="{.items[0].metadata.name}")
kubectl port-forward $POD_NAME 3000
Access Grafana by navigating to http://localhost:3000 in your browser and log in with the admin username and password.
Connecting Data Sources
Grafana supports numerous data sources, each with a dedicated Query Editor. Out of the box, you’ll have access to core data sources and bundled enterprise plugins, with the option to install additional data source plugins as needed.
To add a data source, navigate to Configuration > Data Sources and configure the required fields. After connecting your data source, you can start building powerful Kubernetes dashboards.
Creating Dashboards
Dashboards in Grafana are a collection of panels organised into rows. Each panel represents a single visualisation, like graphs or stats. Let’s walk through creating a basic panel that shows the number of running pods in your Kubernetes cluster.
-
Hover over the Create (+) icon and select Dashboard.
-
Click Add new panel.
-
In the Query Editor, enter the following query and press Shift + Enter:
sum(kube_pod_status_phase{namespace=~".*", phase="Running"})
In the Panel settings, change the title to Running Pods and select Stat under Visualisation.
This simple panel will display the count of running pods in Kubernetes. You can further customise and expand your dashboard by exploring other Kubernetes metrics and adding relevant panels. For additional resources, explore community dashboards on grafana.com.
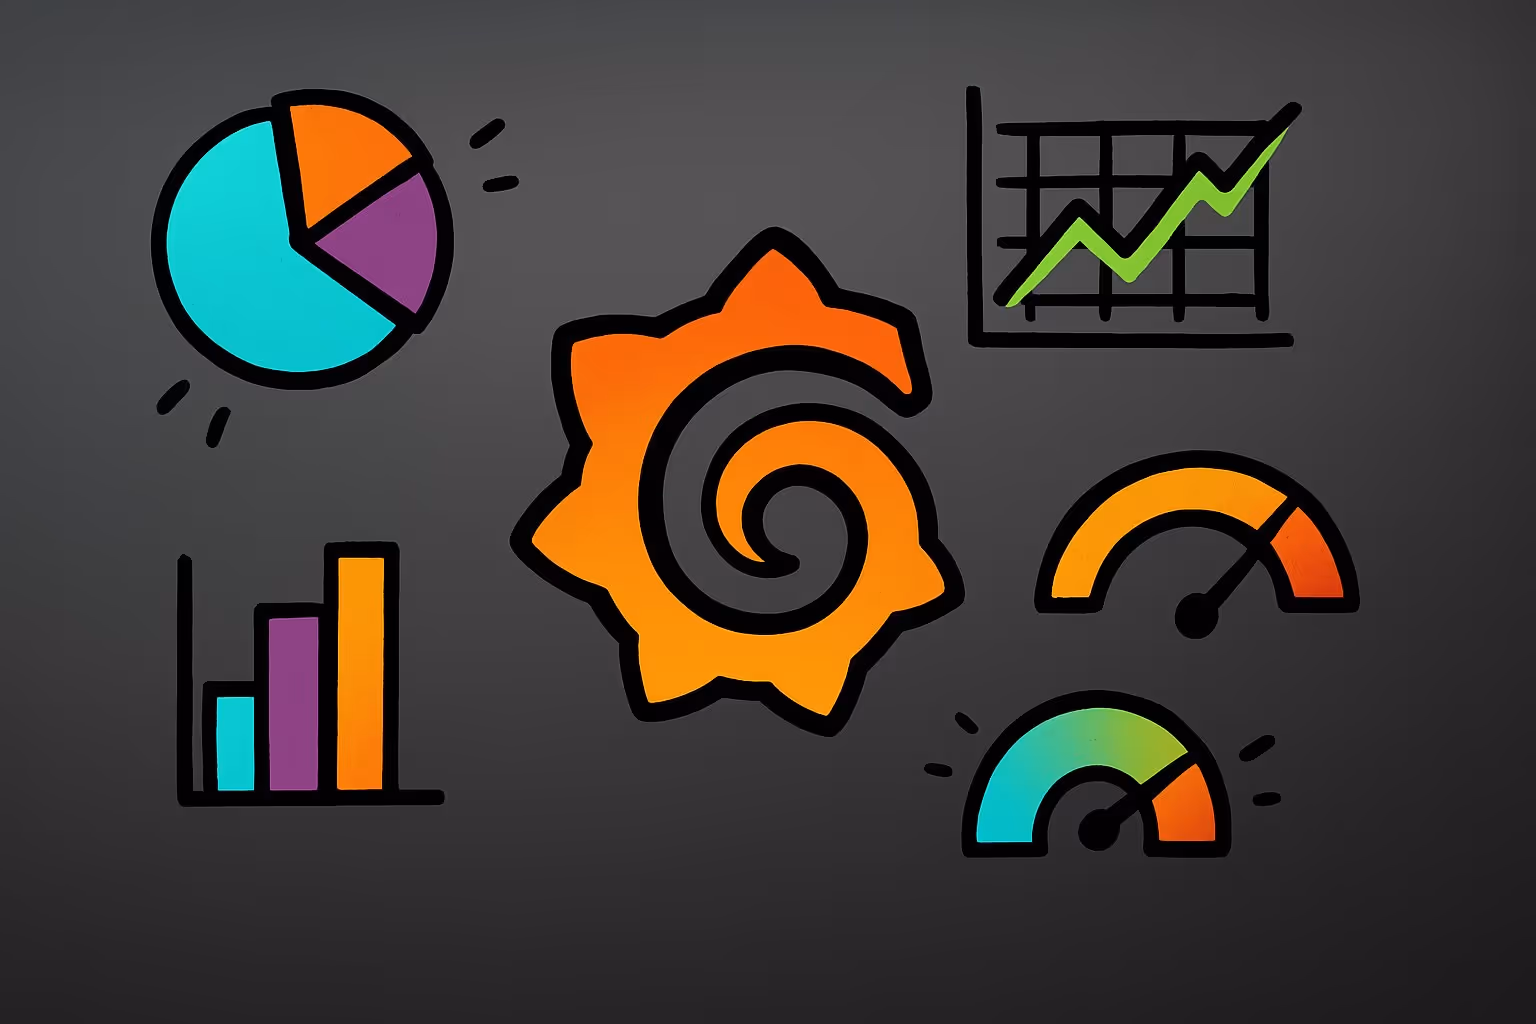
Visualisation Types
Grafana offers a variety of visualisation options to tailor your dashboards:
- Single Stat: Shows a single metric, like the count of running pods.
- Gauge: Displays a single value with set thresholds to indicate acceptable ranges.
- Graph: Ideal for time-series data, such as metrics over time.
- Single Stat with Status: Similar to Gauge, with a single numeric metric and a status range.
- Worldmap: Displays data on a world map, useful for visualising geographically distributed metrics.
Using Variables for Interactive Dashboards
Variables in Grafana allow you to create dynamic, interactive dashboards. Variables appear as dropdown lists, making it easy to switch between data views. Queries are interpolated before being sent to data sources, adapting based on the selected variable values. For advanced options, see the Grafana documentation on variables.
Setting Up Alerts
Grafana’s alerting feature helps you respond proactively to potential issues. Alerts are defined by Rules (conditions that trigger alerts) and Notification Channels (where alerts are sent). Each alert rule can have multiple notifications, making it easy to stay informed on critical metrics.
Tip: Avoid over-alerting to prevent alert fatigue. Instead, define high-priority alerts based on metrics that provide clear indicators of potential issues.
Best Practices for Grafana Dashboards
Here are a few best practices to keep in mind when building Grafana dashboards:
- Keep dashboards easy to read: Design them for clarity, so they’re easily understandable by others.
- Focus on relevant metrics: Avoid cluttering dashboards with unnecessary panels.
- Reduce dashboard refresh rates: Minimise backend load by setting appropriate refresh intervals.
- Use transparent overlays: Avoid excessive stacking of graphs, which can obscure important data points.
Conclusion
Grafana is widely used for its open-source accessibility, flexibility, and compatibility with multiple data sources. When paired with Kubernetes and Prometheus, it’s an excellent choice for visualising and monitoring metrics in a Kubernetes environment, providing teams with clear insights and powerful, customisable dashboards.
By following this guide, you’re ready to set up Grafana on Kubernetes, connect data sources, and create impactful dashboards tailored to your team’s needs.